Schenectady, County

Traffic Ticket & Car Accident Data

Summary

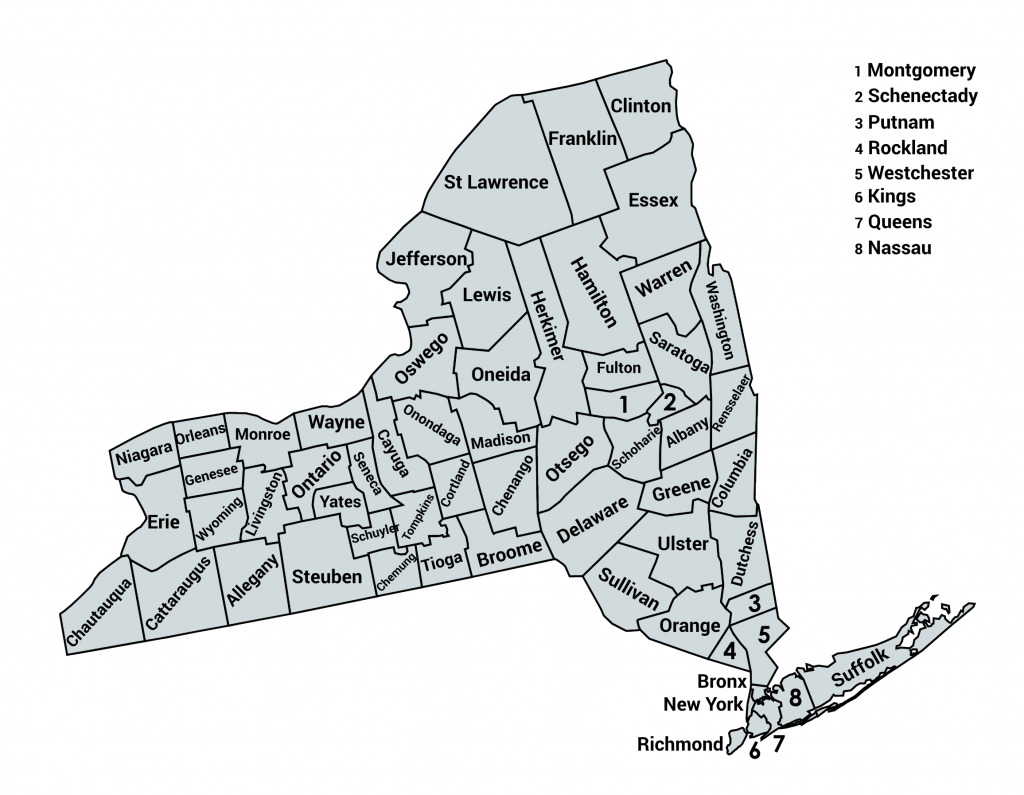
Using newly released data from the New York State Department of Motor Vehicles, the following charts break down how many drivers in have been getting speeding, cell phone and other traffic tickets in Schenectady County from 2009 to 2020. It also shows tickets by age, gender, and time, along with accident and other relevant data.

To share any of the content below see our Material Reproduction policy.

Traffic Tickets 

This graph shows the number of traffic tickets given in Schenectady County, NY from 2009 to 2020.

Total Number of Traffic TicketsTotal Traffic Tickets201020122014201620182020010,00020,00030,00040,000Year
YearTotal Traffic Tickets
2,00936,691
2,01032,876
2,01131,808
2,01230,186
2,01332,316
2,01429,485
2,01530,652
2,01633,441
2,01733,373
2,01829,309
2,01927,049
2,02021,282
 

Cell Phone & Texting Tickets

 Cell Phone VTL 1225(c) & Texting Tickets VTL 1225(d) from 2009 to 2020 in Schenectady County, NY.

Total Cell Phone & Texting TicketsTotal Cell Phone & Texting20092010201120122013201420152016201720182019202005001,0001,5002,000Year
YearTotal Cell Phone & Texting
20091,536
20101,345
20111,015
2012960
20131,504
20141,434
20151,124
20161,091
20171,288
2018725
2019897
2020483
 
Total Cell Phone TicketsTotal Cell Phone20092010201120122013201420152016201720182019202005001,0001,5002,000YearTotal Cell Phone
YearTotal Cell Phone
20091,536
20101,345
20111,015
2012960
20131,504
20141,434
20151,124
20161,091
20171,288
2018725
2019897
2020483
 
Cell Phone Conviction RateConvicted on Same Texting ViolationConvicted on a Non-Texting ViolationDismissed/Acquitted10.6%7.3%82.1%
Texting Dispositionsum Total
Convicted on Same Texting Violation58
Convicted on a Non-Texting Violation451
Dismissed/Acquitted40
 
Texting Tickets2009201020112012201320142015201620172018201920200200400600800YearTotal Cell Phone & Texting
Yearsum Total
2009
201010
201134
2012115
2013363
2014412
2015339
2016481
2017649
2018406
2019476
2020288
 
Texting Conviction RateConvicted on Same Cell Phone ViolationConvicted on a Non-Cell Phone ViolationDismissed/Acquitted11.2%9.7%79.1%
Cell Phone Dispositionsum Total
Convicted on Same Cell Phone Violation59
Convicted on a Non-Cell Phone Violation417
Dismissed/Acquitted51
 

Speeding Tickets

Speeding tickets VTL 1180 from 2009 to 2020 in Schenectady County, NY.

Speeding TicketsTotal Speeding Tickets20092010201120122013201420152016201720182019202002,5005,0007,50010,00012,500Year
yearTotal Speeding Tickets
200910,389
20108,138
20117,706
20127,697
20137,841
20146,888
20157,604
20168,288
20177,344
20186,560
20196,528
20205,438
 
Speeding Ticket Conviction RateConvicted on Different Speeding ViolationConvicted on Same Speeding ViolationConvicted on a Non-Speeding ViolationDismissed/Acquitted35.9%56.7%
Speeding Driver Dispositionsum Total
Convicted on Different Speeding Violation62
Convicted on Same Speeding Violation2,121
Convicted on a Non-Speeding Violation3,352
Dismissed/Acquitted377
 
Speeding Tickets Drivers License JurisdictionCanadaNew York StateNortheast Region**Other US StatesOther/Unknown9.9%84.7%
Driver Licensesum Total
Canada16
New York State6,184
Northeast Region**723
Other US States271
Other/Unknown108
 
Speeding in School Zone§ 1180-c Speeding in School Zone2009201020112012201320142015201620172018201920200200400600800Year
year§ 1180-c Speeding in School Zone
2009590
2010315
2011289
2012455
2013745
2014641
2015409
2016340
2017314
2018183
2019261
202072
 
Speeding in Work Zone§ 1180-f Speeding in Posted Work Zone200920102011201220132014201520162017201820192020050100150200250Year
year§ 1180-f Speeding in Posted Work Zone
200950
2010113
2011212
201299
2013130
2014131
201565
2016202
201783
201899
201979
202088
 

Seat Belt Tickets 

Seat Belt Tickets VTL 1229 from 2009 to 2020 in Schenectady County, NY.

Seat Belt TicketsTotal Seat Belt Tickets201020122014201620182020010,00020,00030,00040,000Year
YearTotal Seat Belt Tickets
2,00936,691
2,01032,876
2,01131,808
2,01230,186
2,01332,316
2,01429,485
2,01530,652
2,01633,441
2,01733,373
2,01829,309
2,01927,049
2,02021,282
 

Impairment Tickets 

Impairments Tickets VTL 1192.1-4 from 2009 to 2020 in Schenectady County, NY.

Total Impairment TicketsImpairment Tickets2010201220142016201802505007501,0001,250Year
yearImpairment Tickets
2,009791
2,010875
2,0111,014
2,012716
2,013737
2,014581
2,015635
2,016647
2,017604
2,018640
 
Impairments by Age and GenderFemaleMale0102030405060708016 - 2021 - 2930 - 3940 - 4950 - 5960 and OverAge Group
Age groupsFemaleMale
16 - 2036
21 - 292977
30 - 394080
40 - 492438
50 - 591337
60 and Over516
 
Impairments by Time of DayMid - 3 am3am - 6am6am - 9am9am - NoonNoon - 3pm3pm - 6pm6pm - 9pm9pm - Mid020406080100TimeframeTotal Impairments
hour_tssrTotal
Mid - 3 am92
3am - 6am37
6am - 9am9
9am - Noon10
Noon - 3pm15
3pm - 6pm35
6pm - 9pm63
9pm - Mid82
 
Impairments by Day of WeekSundayMondayTuesdayWednesdayThursdayFridaySaturday020406080100WeekdayTotal Impairments
day_of_weekDay of WeekDayNum
Sunday630.01
Monday400.02
Tuesday320.03
Wednesday390.04
Thursday570.05
Friday560.06
Saturday810.07
 
Impairments by MonthJanuaryFebruaryMarchAprilMayJuneJulyAugustSeptemberOctoberNovemberDecember010203040MonthTotal Impairments
MonthDay of WeekMonthNun
January260.01
February360.02
March280.03
April120.04
May200.05
June170.06
July250.07
August290.08
September260.09
October260.1
November280.11
December240.12
 
Total Impairment Conviction Rate (Drugs and Alcohol Combined)Convicted on Different Impairment ViolationConvicted on Non-Impairment ViolationConvicted on Same Impairment ViolationDismissed/Acquitted6.5%41.1%51.4%
Impaied Driver Dispositionsum Total
Convicted on Different Impairment Violation150
Convicted on Non-Impairment Violation3
Convicted on Same Impairment Violation120
Dismissed/Acquitted19
 
Alcohol Conviction RateConvicted on Same Impairment ViolationConvicted on Different Impairment ViolationConvicted on Non-Impairment ViolationDismissed/Acquitted42.2%6.3%50.8%
Impaied Driver DispositionTotal
Convicted on Same Impairment Violation108
Convicted on Different Impairment Violation130
Convicted on Non-Impairment Violation2
Dismissed/Acquitted16
 
Drugs Conviction RateConvicted on Same Impairment ViolationConvicted on Different Impairment ViolationConvicted on Non-Impairment ViolationDismissed/Acquitted30.3%9.1%57.6%
Impaied Driver DispositionTotal
Convicted on Same Impairment Violation10
Convicted on Different Impairment Violation19
Convicted on Non-Impairment Violation1
Dismissed/Acquitted3
 

Vehicular Accidents 

Vehicular crashes from 2009 to 2020 in Schenectady County, NY.

 
NOTE: Due to changes made by the Police Accident Report form with regards to the capture and reporting of property damage crashes, users will see a significant increase in the number of property damages crashes in 2019, compared to previous years.
Total Number of CrashesTotal Crashes20102012201420162018202001,0002,0003,0004,0005,000Year
YEARTotal Crashes
2,0093,456
2,0103,351
2,0113,319
2,0122,948
2,0133,044
2,0143,156
2,0153,468
2,0163,249
2,0173,333
2,0183,978
2,0194,137
2,0203,470
 
Total Motorcycle CrashesMotorcycle Crashes201020122014201620182020020406080Year
YEARMotorcycle Crashes
2,00960
2,01058
2,01158
2,01261
2,01355
2,01446
2,01545
2,01646
2,01749
2,01835
2,01937
2,02041
 
Total Bicycle and Motor Vehicle CrashesBicycle and Motor Vehicle Crashes2010201220142016201820200204060Year
YEARBicycle and Motor Vehicle Crashes
2,00960
2,01052
2,01154
2,01251
2,01343
2,01446
2,01548
2,01646
2,01738
2,01834
2,01940
2,02041
 
Total Pedestrian and Motor Vehicle CrashesPedestrian and Motor Vehicle Crashes201020122014201620182020020406080100Year
YEARPedestrian and Motor Vehicle Crashes
2,00977
2,01071
2,01185
2,01269
2,01382
2,01481
2,01599
2,01679
2,01772
2,01882
2,01967
2,02049
 
Total Crashes by MonthJanuaryFebruaryMarchAprilMayJuneJulyAugustSeptemberOctoberNovemberDecember0100200300400MonthTotal Crashes
MonthMonthMonth Number
January3680.01
February3660.02
March2200.03
April1560.04
May2270.05
June2910.06
July2710.07
August2590.08
September2970.09
October3120.1
November3360.11
December3670.12
 
Total Crashes by Day of WeekSundayMondayTuesdayWednesdayThursdayFridaySaturday0100200300400500600WeekdayTotal Crashes
Day of WeekDay of WeekSort
Sunday3210.01
Monday4720.02
Tuesday5090.03
Wednesday5200.04
Thursday5150.05
Friday5830.06
Saturday4130.07
 
 
Driver GenderFemaleMaleUnknown Gender41.9%52.9%
Gendersum Total
Female2,265
Male2,859
Unknown Gender276
 
Human FactorsDriver Inattention/DistractionFailure to Yield Right-of-WayFollowing Too CloselyPassing/Lane Changing/Improper UseOther22.2%16.6%34.5%11.9%14.8%
Contributing Factorssum Total
Aggressive Driving/Road Rage18
Alcohol Involvement85
Backing Unsafely182
Cell Phone (hand held)9
Driver Inattention/Distraction821
Driver Inexperience53
Drugs (Illegal)14
Eating or Drinking2
Failure to Keep Right65
Failure to Yield Right-of-Way616
Fatigued/Drowsy13
Fell Asleep40
Following Too Closely547
Illness17
Listening/Using Headphones1
Lost Consciousness20
Other Electronic Device3
Outside Car Distraction10
Passenger Distraction8
Passing/Lane Changing/Improper Use441
Pedestrian/Bicyclist Error/Confusion44
Physical Disability4
Prescription Medication3
Reaction to Other Uninvolved Vehicle73
Texting2
Traffic Control Device Disregarded170
Turning Improperly128
Unsafe Speed310
Using On Board Navigation Device3
 
Contributing Human FactorsAlcohol InvolvementDrugs (Illegal)2009201020112012201320142015201620172018050100150YearCrashes
YEARAlcohol InvolvementDrugs (Illegal)
20091315
20101005
201113214
20121062
2013929
2014882
20158016
20167613
20178514
20181208
 
Contributing Human FactorsDriver Inattention/DistractionUnsafe Speed2009201020112012201320142015201620172018201902505007501,0001,250YearCrashes
YEARDriver Inattention/DistractionUnsafe Speed
2009944268
2010985323
20111,030287
2012919247
2013896276
2014857281
2015811260
2016822267
2017821310
2018926391
2019960354
 
Vehicular FactorsBrakes DefectiveOther VehicularOversized VehicleSteering FailureTire Failure/InadequateOther22.1%24%6.7%20.2%8.7%18.3%
Contributing Factorssum Total
Accelerator Defective2
Brakes Defective23
Driverless/Runaway Vehicle1
Headlights Defective1
Other Lighting Defects2
Other Vehicular25
Oversized Vehicle19
Steering Failure9
Tire Failure/Inadequate21
Windshield Inadequate1
 
Environmental FactorsAnimal's ActionGlarePavement SlipperyView Obstructed/LimitedOther35.9%12.9%41.4%
Contributing Factorssum Total
Animal's Action220
Glare29
Lane Marking Improper/Inadequate1
Obstruction/Debris20
Pavement Defective4
Pavement Slippery254
Shoulders Defective/Improper1
Traffic Control Device Improper/Non-Working5
View Obstructed/Limited79
 

Material Reproduction

If you’d like to share this on social media or your own website, you’re welcome to do so. We simply request that you link back to this page to give our team credit for our work – that’s the kind of citation we can all appreciate.

Media Contact

To learn more about this data, for quotes, interviews or other data requests please contact Elie@rosenblumlawfirm.com.

About the Rosenblum Law & TrafficTickets.com

Rosenblum Law is the largest and highest customer-rated traffic violations law firm in both NY & NJ. With experienced and skilled traffic violations and criminal defense attorneys, the Firm has a reputation for aggressive representation for anyone facing traffic violations and criminal charges that may result in heavy fines, points and license suspension or revocation, and jail time. With a success rate of well over 90%, the Firm has helped thousands of clients get excellent results regardless of how simple or complicated the case. The attorneys pride themselves on working relentlessly to reach the best possible outcome.

Other NY Counties

chevron-down Free Consult Call Now linkedin facebook pinterest youtube rss twitter instagram facebook-blank rss-blank linkedin-blank pinterest youtube twitter instagram