New York Speeding Ticket Data
Last Updated: 12/24/24
Summary
Rosenblum Law has analyzed data from the Institute of Traffic Safety Management & Research to determine the most common times and locations that police issue speeding tickets. The goal of making this page is to increase transparency into how our police agencies are giving our tickets and how it affects driver safety and quality of life. To do this, we have looked at accident data, conviction rates, as well the month, day, and time tickets were issued.
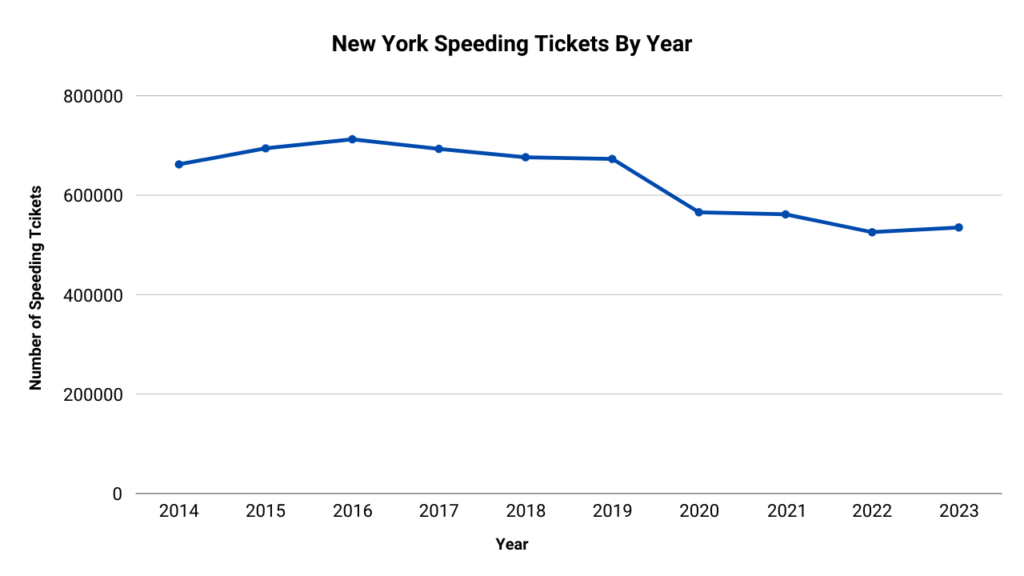
Speeding Tickets By Year
Other Speeding Tickets Types By Year
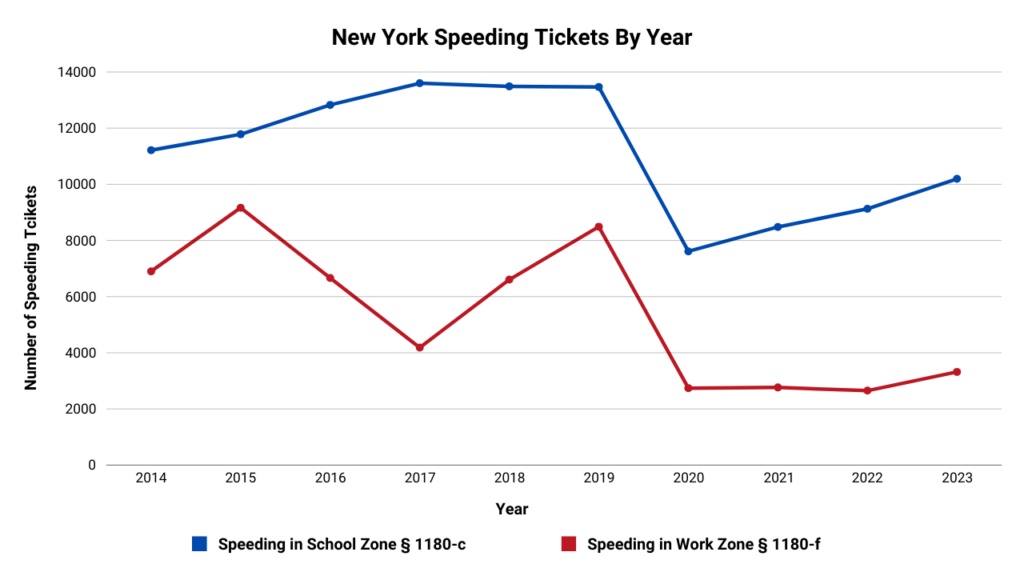
This graph shows the number of school zone and work zone speeding tickets given in New York State from 2014 to 2023.
When Are You The Most Likely To Get A Speeding Ticket?
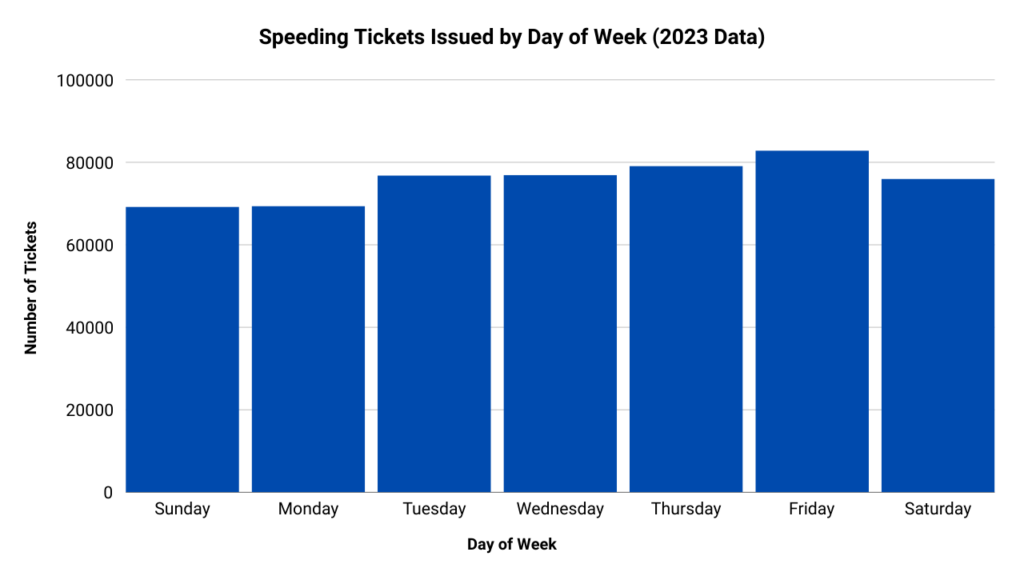
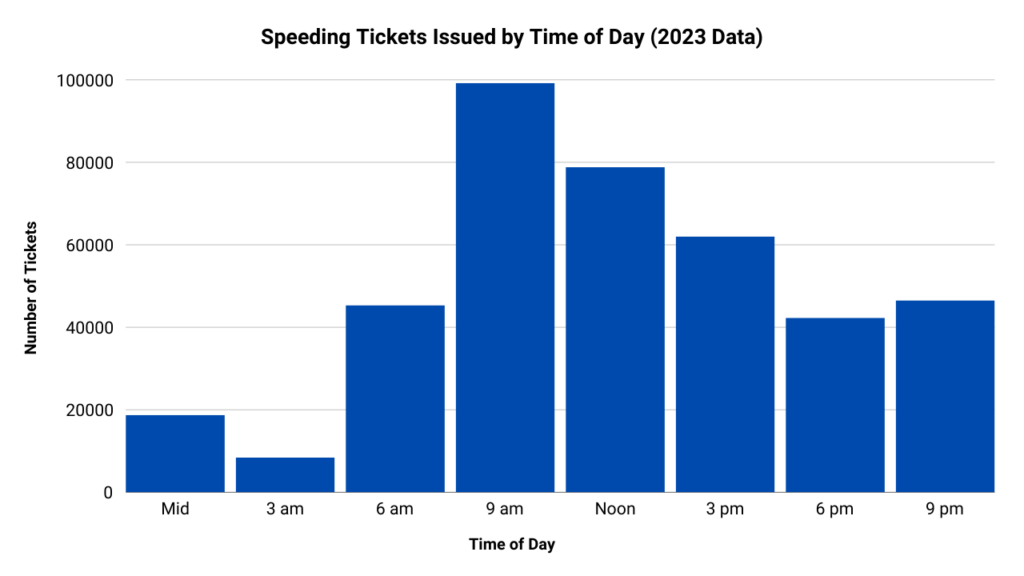
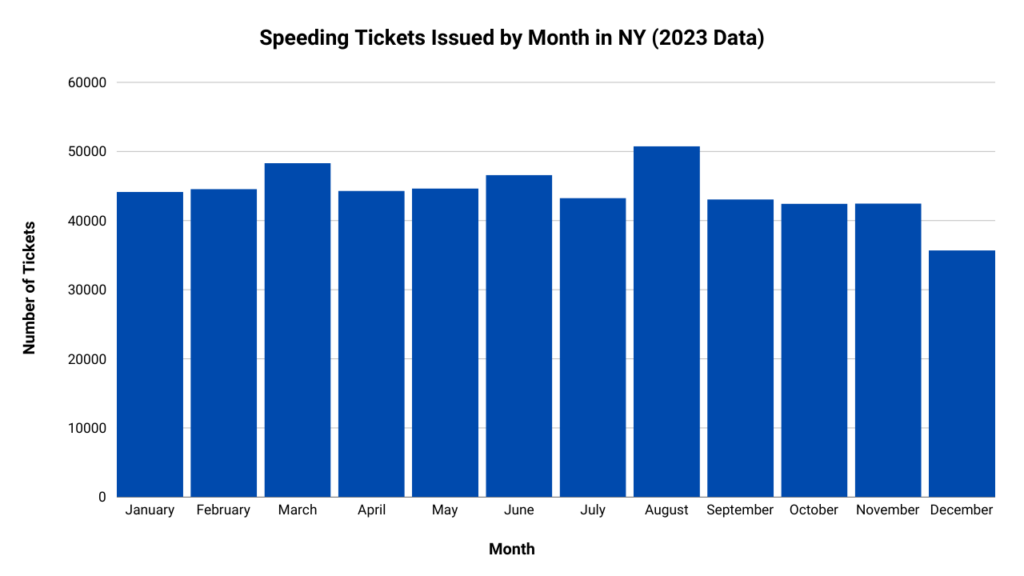
The graphs below show the day of the week, time of day and month of the year you are the most likely to get a speeding ticket, according to 2023 data.
Drivers Ticketed By Day Of Week
Drivers Ticketed By Time Of Day
Drivers Ticketed By Month
Age & Gender Statistics
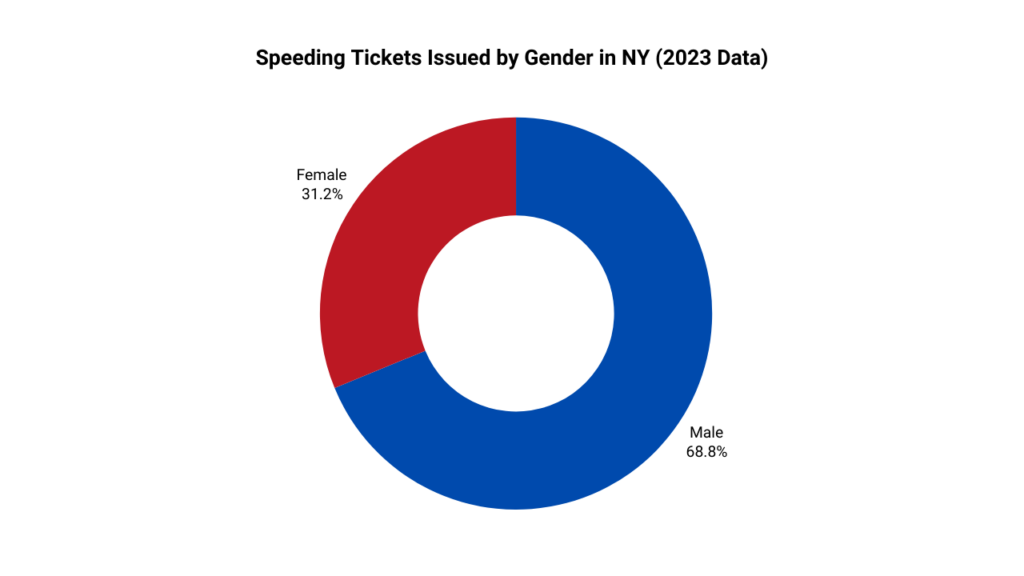
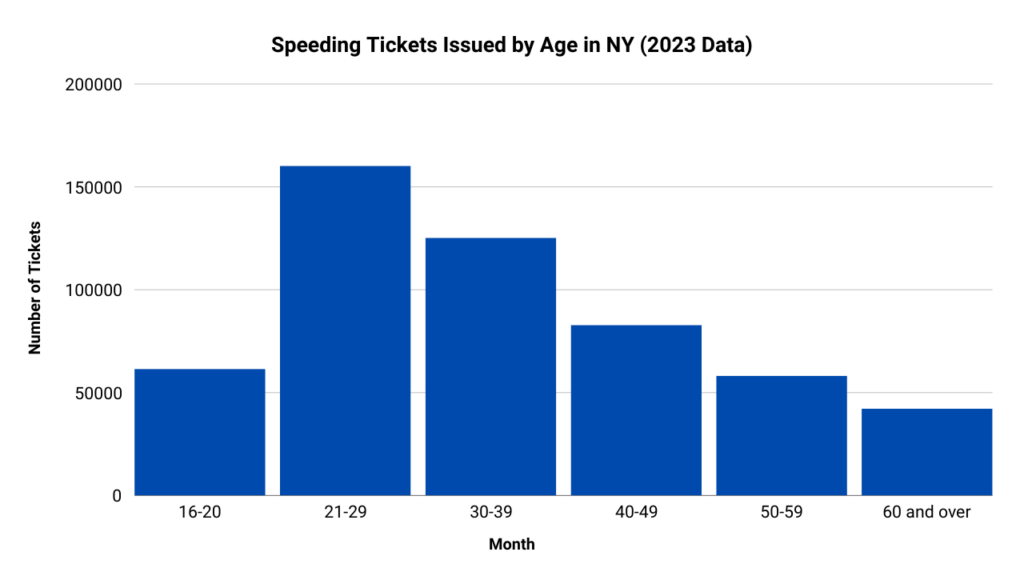
Below are statistics about the number of tickets that are given out to males and females as well as the different ages that get the most tickets.
Drivers Ticketed By Gender
Drivers Ticketed By Age
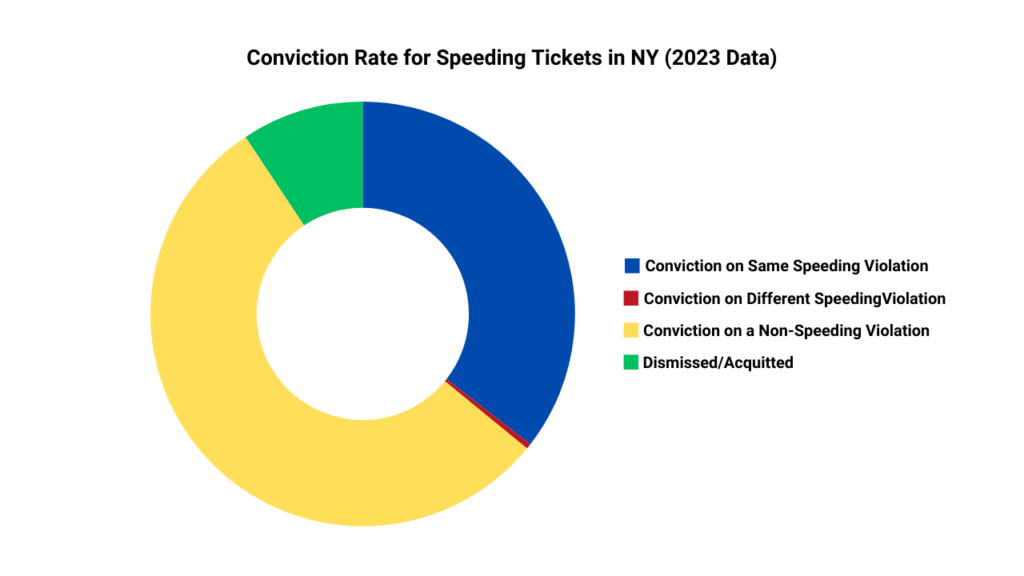
Conviction Rate
This graph shows the conviction rate of speeding tickets across New York State.
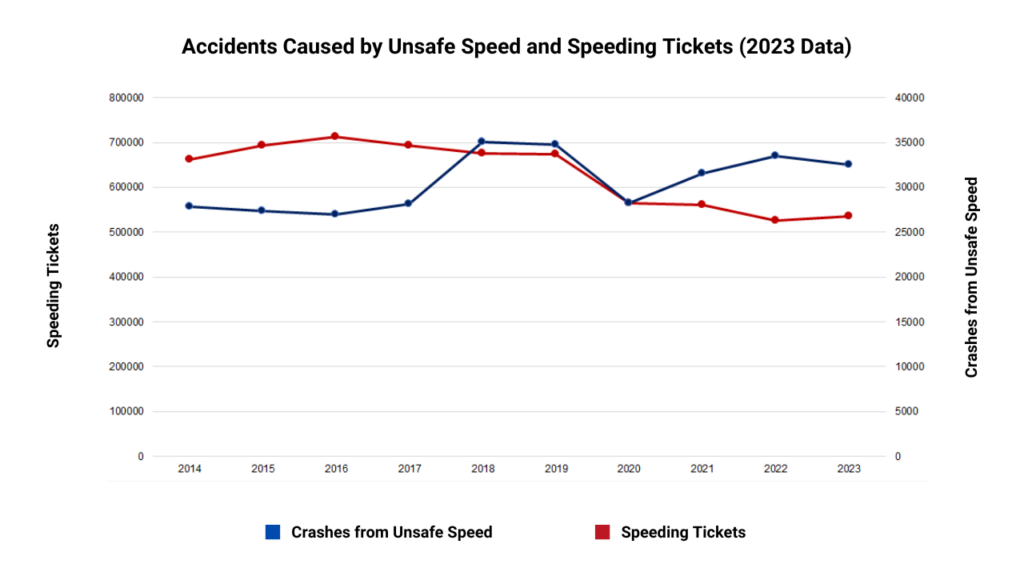
Accidents Caused By Unsafe Speed & Speeding Tickets By Year
This graph shows the number of accidents caused by unsafe speed and the number of speeding tickets given in New York State from 2014 to 2023.
Material Reproduction
If you’d like to share this on social media or your own website, you’re welcome to do so. We simply request that you link back to this page to give our team credit for our work – that’s the kind of citation we can all appreciate.
Media Contact
To learn more about this data, for quotes, interviews or other data requests please contact Elie@rosenblumlaw.com.
About the Rosenblum Law & TrafficTickets.com
Rosenblum Law is the largest and highest customer-rated traffic violations law firm in both NY & NJ. With experienced and skilled traffic violations and criminal defense attorneys, the Firm has a reputation for aggressive representation for anyone facing traffic violations and criminal charges that may result in heavy fines, points and license suspension or revocation, and jail time. With a success rate of well over 90%, the Firm has helped thousands of clients get excellent results regardless of how simple or complicated the case. The attorneys pride themselves on working relentlessly to reach the best possible outcome.
Traffic Ticket and Accident Data in NY Counties
