By: Adam H. Rosenblum Esq. Published: 11/4/19

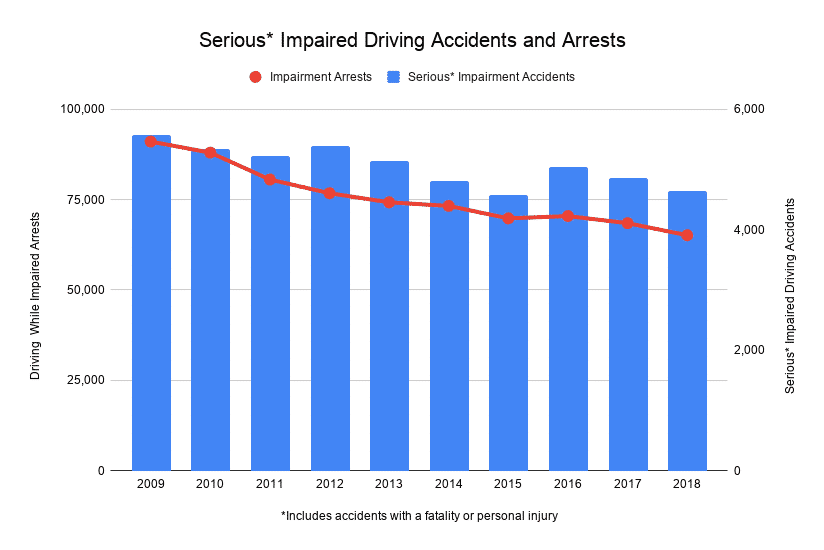
New Yorkers continued a multi-year trend of cutting back on driving while impaired by drugs and alcohol. Newly released data from the NYS Department of Motor Vehicles shows that impaired-driving-related accidents are on the decline. Police reported 4.4% fewer serious accidents in which drugs or alcohol were a factor in 2018. The news is all the better given that in 2018 police issued the fewest number of drunk driving citations in the past 10 years.
The number of drug- or alcohol-related crashes involving injuries declined from 4,861 in 2017 to 4,647 in 2018. This figure represents a 17% drop in serious impaired driving crashes from 2009, the earliest data available.
The decline in impaired driving coincides with a drop in DWI citations across the state. Last year, state and local police wrote 65,125 tickets for driving under the influence of drugs or alcohol. This is 5% fewer impaired driving tickets than in 2017 (68,471) and 28% fewer than in 2009. In New York City alone, the number of DWI charges filed against drivers declined almost 10% from 6,927 in 2017 to 6,241 last year.

| Year | Fatal Crashes | Personal Injury Crashes | Total Serious Crashes |
|---|---|---|---|
| 2009 | 430 | 5,139 | 5,569 |
| 2010 | 467 | 4,869 | 5,336 |
| 2011 | 427 | 4,799 | 5,226 |
| 2012 | 428 | 4,967 | 5,395 |
| 2013 | 438 | 4,703 | 5,141 |
| 2014 | 358 | 4,453 | 4,811 |
| 2015 | 431 | 4,137 | 4,568 |
| 2016 | 380 | 4,657 | 5,037 |
| 2017 | 351 | 4,510 | 4,861 |
| 2018 | 449 | 4,198 | 4,647 |
Where Did the Most Impaired Driving Accidents in NYS Occur?
Long Island and New York City saw the largest proportion of serious auto accidents involving impaired drivers in 2018. Suffolk County, which includes tourist hotspots like Montauk, the Hamptons, and Robert Moses Beach, had the greatest number of accidents of any other single county, with 470 such crashes. It is followed by Brooklyn, which saw 405, and Queens, where 335 took place. Despite these high figures, each county saw a decline in the overall number of impaired-driving accidents in which persons were injured or killed.
Among New York State’s 62 counties, more saw a decline in serious impaired driving accidents than not. Five counties--Monroe, Westchester, Staten Island, Albany, and Washington--were flat
| County | 2017 | 2018 | Rate of Change |
|---|---|---|---|
| SCHUYLER | 13 | 6 | -53.80% |
| LEWIS | 14 | 7 | -50.00% |
| CHAUTAUQUA | 59 | 33 | -44.10% |
| ST. LAWRENCE | 44 | 27 | -38.60% |
| COLUMBIA | 35 | 23 | -34.30% |
| ALLEGANY | 18 | 12 | -33.30% |
| HERKIMER | 25 | 17 | -32.00% |
| ONEIDA | 67 | 46 | -31.30% |
| TIOGA | 23 | 16 | -30.40% |
| FULTON | 18 | 13 | -27.80% |
More Older Drivers Being Charged with Impaired Driving
The proportion of older drivers getting ticketed for driving under the influence of drugs or alcohol rose again in 2018. Even though the total number of impaired driving tickets fell in 2018, the number of drivers ages 60+ charged with impaired driving increased by 7.4%, from 2,008 in 2017 to 2,157 in 2018. This trend was similar among both men and women.
While the proportion of drivers between ages 30 and 59 charged with impaired driving rose (from 55.7% to 57.6%), the actual number edged down from 19,815 in 2017 to 19,603 in 2018.
Younger drivers seem to be accepting the dangers of driving while impaired. Nearly 39% of impaired driving charges were issued to drivers aged 29 or younger in 2017. In 2018, drivers under 29 received just 36% of tickets. Overall, there was an 11% decline in drivers under 30 charged with driving while impaired.
Given the serious risk of injury and death associated with impaired driving, a decline in both impaired driving accidents means safer streets for everyone. The decrease in impaired driving among younger New Yorkers is particularly encouraging, as it hopefully means these good habits will stay with them as they get older. It also matches up with an overall trend of younger drivers getting fewer traffic tickets. To see more traffic violation and accident trends from 2018, check out our other data pages.


